

Scientists have developed an AI-powered MRI body composition calculator using data from more than 66,000 adults to uncover how hidden age-related changes in fat and muscle can indicate future risk of diabetes, heart disease, and premature death.
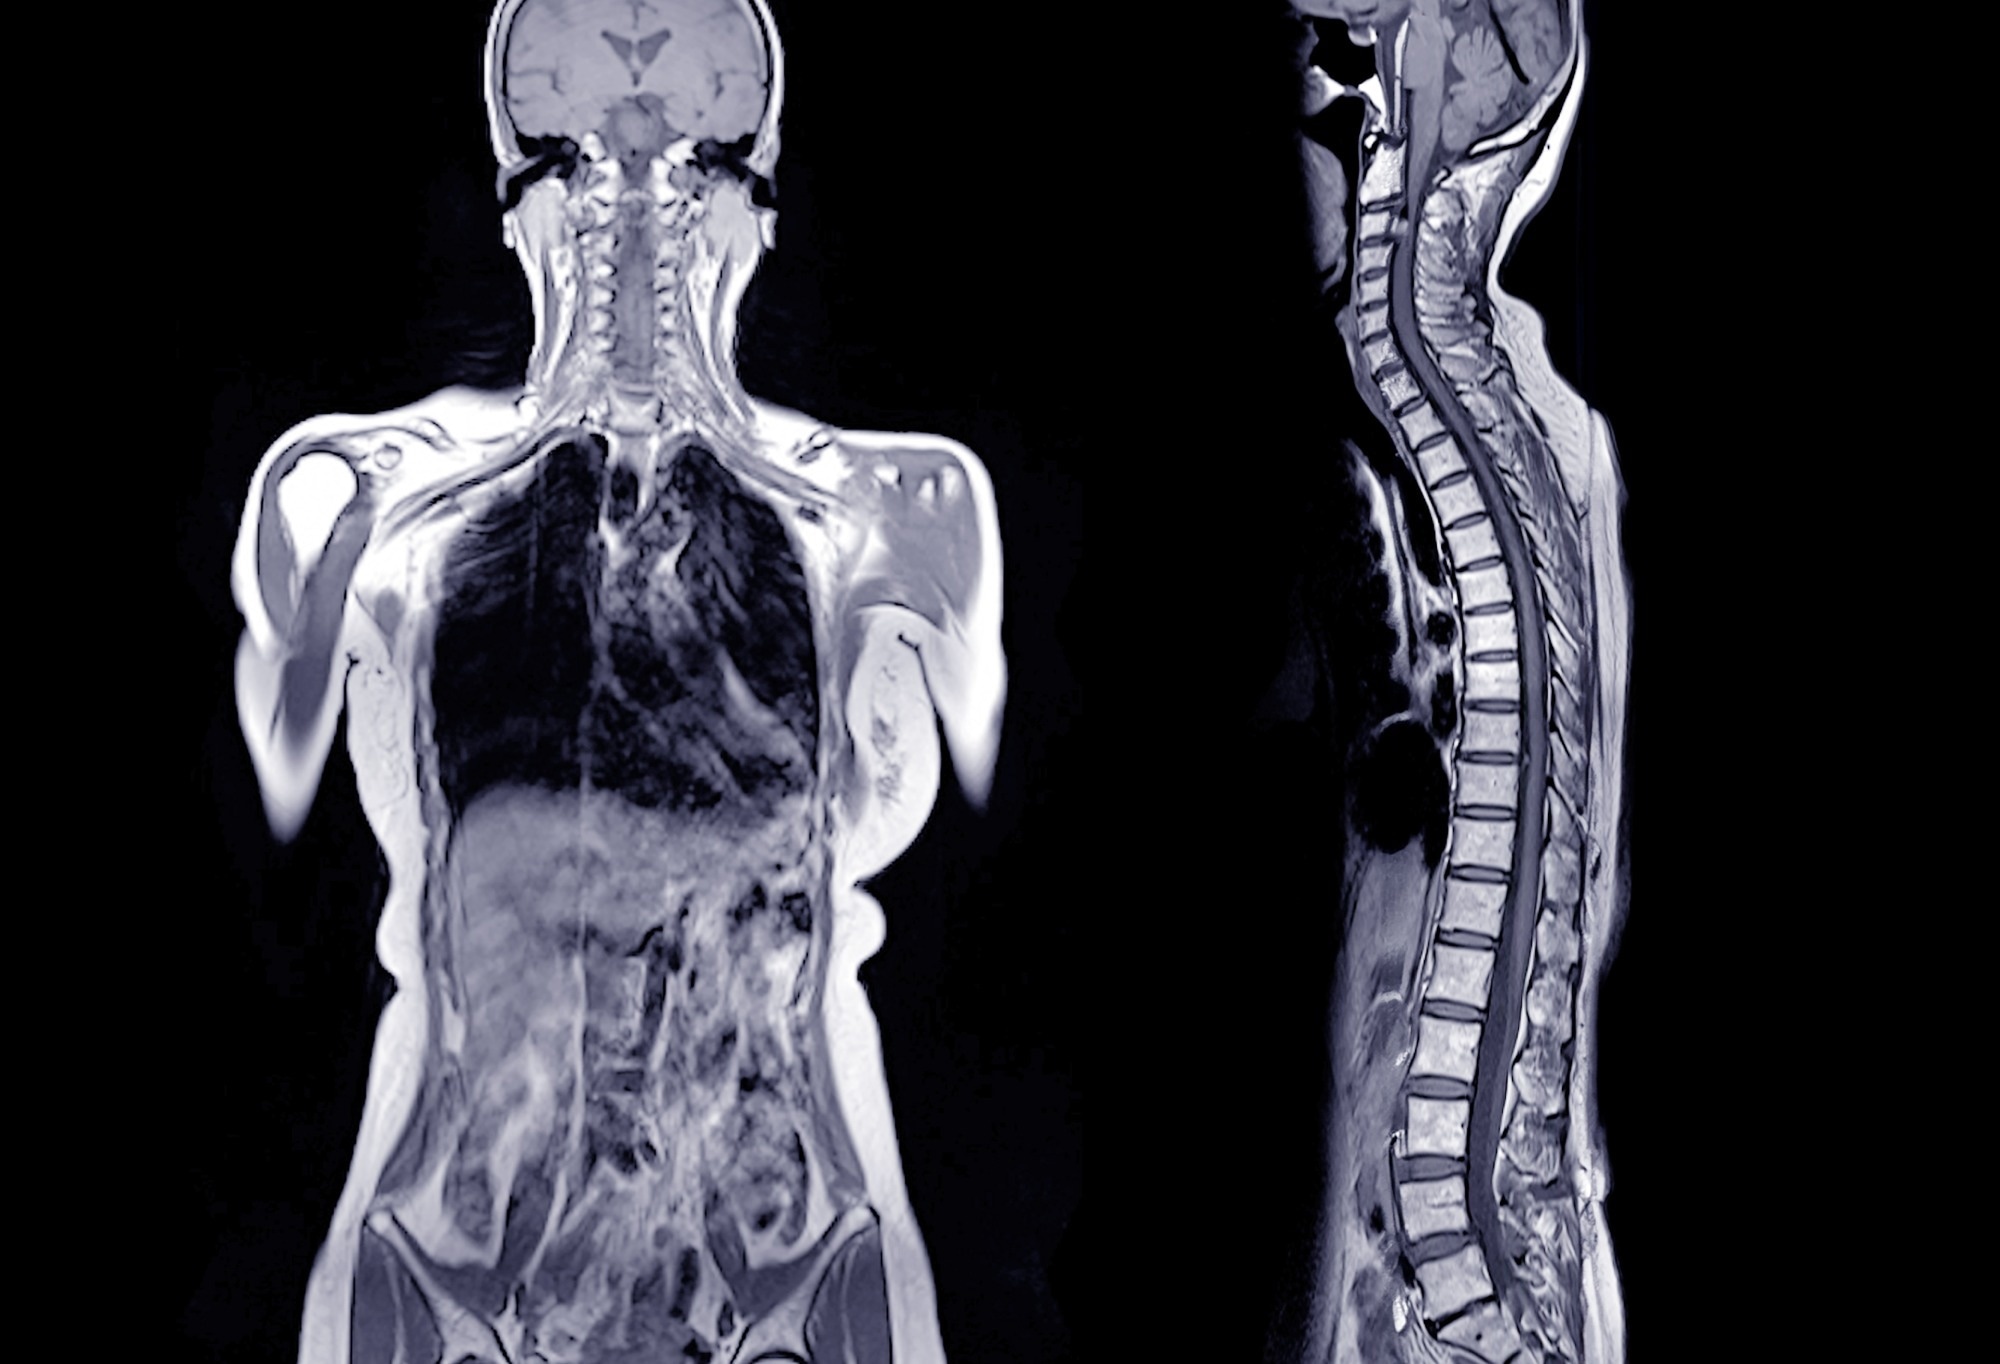 Research: Body Composition in the General Population: A Reference Curve from Whole-body MRI of More than 66,000 People. Image credit: Radiology Imaging/Shutterstock.com
In a recent study published in RadiologyResearchers estimated body composition (BC) indicators from magnetic resonance imaging (MRI) scans of the general population.
MRI body composition reveals hidden risk of cardiometabolic diseases
Computed tomography (CT) and MRI are critical in supporting diagnosis, prognosis, and disease monitoring. There is evidence that BC indicators such as skeletal muscle (SM) and adipose tissue compartments obtained from CT and MRI scans are risk factors for cancer, cardiometabolic disease, and mortality. Nevertheless, these measures are influenced by gender, height, and age. Furthermore, comprehensive reference curves of BC changes over the lifespan are lacking.
Therefore, tools that can adjust BC indices derived from MRI images to account for confounders can improve screening accuracy and guide treatment decisions and prevention strategies. Large-scale imaging studies conducted in the general population can be leveraged to establish a BC reference curve. Manual measurement of BC in large datasets is time-consuming, but deep learning techniques allow automated, efficient, and accurate quantification from imaging.
Quantify muscle and fat compartments with an AI framework
In the current study, researchers used an automated deep learning framework to calculate age-, height-, and gender-normalized BC measurements from MRI scans of more than 66,000 individuals. Data from two general population cohort studies were used: the German National Cohort (NAKO) and the UK Biobank (UKB) cohort. Comprehensive MRI was performed on some participants in both studies.
In the current study, we quantified BC using MRI data from 30,291 NAKO and 36,317 UKB subjects. Furthermore, we applied a fully automated open-source deep learning framework to quantify BC measurements, including SM, visceral adipose tissue (VAT), SM fat fraction (SMFF), intramuscular adipose tissue (IMAT), and subcutaneous adipose tissue (SAT). Survival analysis was performed only in the UKB cohort as data were not available in the NAKO cohort.
Incident outcomes included major cardiovascular events (MACE); This includes myocardial infarction, ischemic stroke, cardiovascular death, diabetes, and all-cause death. Covariates included age, body mass index (BMI), gender, smoking status, race, alcohol intake, cancer history, hypertension, and use of antihypertensive medications. For BC measurements, a reference curve stratified by gender based on height and age was constructed. Z-scores were calculated for each BC measurement compared to age-, sex-, and height-matched peers.
The association between Z score and outcome is low (z < -1)、高 (z> 1), investigated in the Z-score category of medium (z: -1 to 1). Kaplan-Meier survival estimates were calculated to assess time to outcome in UKB. Cox proportional hazards regression was used to examine the association between Z-score categories and outcomes while adjusting for specified covariates.
Abnormal body composition predicts diabetes and mortality risk
The study involved 66,608 participants with a mean age of 57.7 years from the NAKO and UKB cohorts. The mean BMI of the entire cohort was 26.2 kg/m2. Women had higher SAT, IMAT, and SMFF than men, whereas men had higher VAT and SM than women. SAT was positively correlated with age, with slightly reduced variation over the lifespan. VAT showed an increase over the lifespan and was much more variable for older people.
Skeletal muscle decreased with age and became less variable after age 50, whereas baseline curve analysis suggested that decline in SM may begin as early as age 30, whereas IMAT and SMFF increased and became more variable over decades. Furthermore, SAT was the main BC indicator in women across decades of age, with only small differences ranging from 57% at ages 20–30 to 61% at ages 50–60 and 70+. In men, SM was the main BC measure from 20 to 70 years of age.
In both men and women, with age, VAT moved from the pelvis to the abdomen, and SAT moved from the buttocks to the chest. Paraspinal IMAT has migrated from the lower lumbar spine to the upper thoracic spine over several decades in both men and women. Differences in SM were less pronounced, but varied from the chest to the buttocks in men and from the buttocks to the chest and trunk in women.
In the UKB cohort, after excluding those with prevalent diabetes, those with a history of insulin use, and those who had suffered a myocardial infarction or stroke, 532 people were diagnosed with diabetes, 553 developed MACE, and 563 died. Higher SMFF and VAT Z-score categories were associated with a higher risk of developing diabetes. Higher IMAT and SMFF Z-score categories were associated with higher MACE risk and all-cause mortality. Lower Z-score categories of SM were associated with increased all-cause mortality.
Supporting health checkups with AI body composition monitor
In summary, this study quantified BC indicators obtained from MRI scans in the general population. The results showed that high visceral fat and SM fat fraction were associated with a high risk of diabetes, and high intramuscular fat and SM fat fraction were associated with a high risk of MACE. Lower SM, as well as higher SM fat fraction and intramuscular fat, was associated with increased all-cause mortality above and beyond traditional risk factors.
A limitation of this study is that it included a predominantly white, Western European adult sample from the United Kingdom and Germany with a mean BMI in the overweight range, limiting generalizability to other racial and ethnic groups, populations with different BMI distributions, children, and clinical populations.
Click here to download your PDF copy.
Reference magazines:
-
Jung M, Reisert M, Rieder H, et al. (2026). Body composition of the general population: A reference curve derived from whole-body MRI of over 66,000 people. Radiology, 319(2), e251939. Toi: 10.1148/radiol.251939. https://pubs.rsna.org/doi/10.1148/radiol.251939