

Researchers have long known that plastic pollution is reaching the oceans. However, little is known about how much plastic gets trapped before it reaches the ocean.
As professors of environmental engineering, geography and environmental studies, and oceanography at Penn State, we recently led a study to map how microplastics move through waters across Pennsylvania. What we discovered was shocking. Microplastics are nearly ubiquitous, concentrations in sediments double every 20 years, and some of the most common types are among the most toxic.
Plastic is everywhere, including inside us
Since the 1950s, global plastic production has doubled approximately every 20 years. The world currently produces more than 500 million tons per year, which is roughly equivalent to the combined weight of all humans on Earth.

Plastic has revolutionized our lives, but more than half of plastic waste ends up in landfills.
Nathaniel Warner
Currently, more than half of plastic waste worldwide ends up in landfills, and less than one-tenth is recycled. The United States generates more than 48 million tons of plastic waste annually, with approximately 86% going to landfills. Domestic recycling rates are around 5% to 6%, making the United States a leading plastic polluter. The rest enters the environment and slowly breaks down into microplastics, possibly over hundreds to thousands of years. These particles range in size from 5 millimeters, the size of an eraser, to 1 nanometer. For reference, a single human hair is approximately 80,000 nanometers wide.
Microplastics currently exist in air, water, soil, food, and living organisms, including humans. Microplastics enter our bodies through what we drink, inhalation, and skin contact. Studies have found that microplastics accumulate in the human blood, brain, and reproductive system.
To understand how plastics pose a health threat, it helps to know how they are classified in the first place. In the United States, plastics are divided into seven categories by the resin identification code system and are identified by numbered recycling triangles on the bottom of the container.
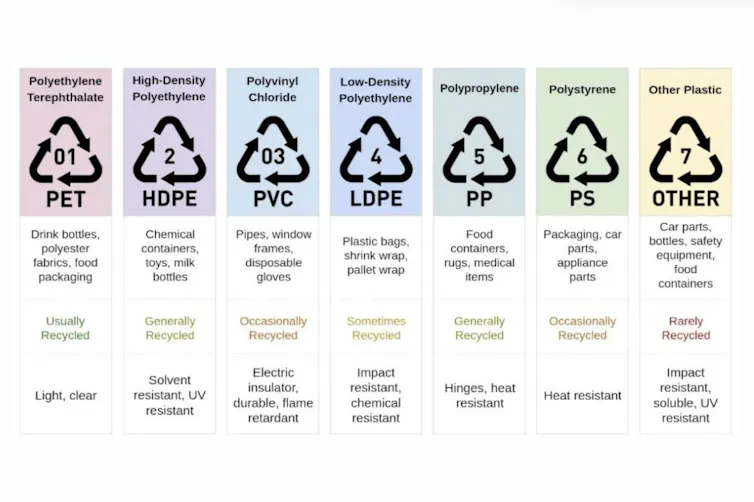
The resin code system was created to help identify plastic types.
Oliver Ludwell
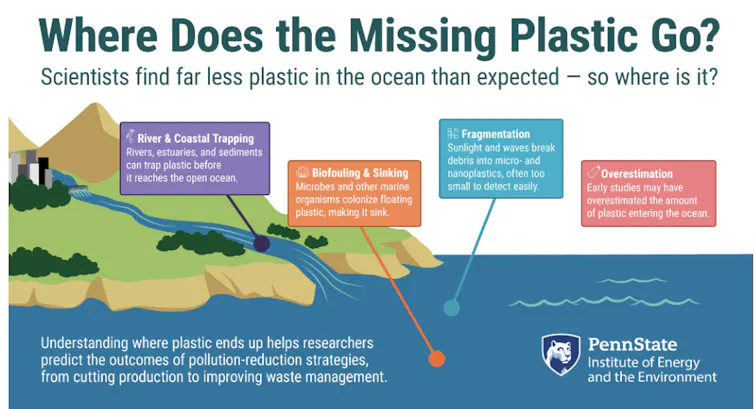
The mystery of lost plastic
It is estimated that more than 80% of mismanaged plastic waste (plastics that are littered, dumped, or not properly contained) is transported to coastal environments by rivers.
You’ve probably heard of the Great Pacific Garbage Patch, the world’s largest collection of ocean plastic located between Hawaii and California. While that’s definitely huge, there’s much less plastic in the ocean than models predict, considering how much is produced and lost to the environment every year. In fact, millions of tons remain unaccounted for. Our team set out to investigate some of the mysteries of the “lost plastic paradox.”
Researchers are investigating how plastic is redistributed through watersheds.
Penn State Energy and Environment Institute
Our research focused on Pennsylvania’s Raystown Lake, Conemaugh River Lake, and the John Heinz National Wildlife Refuge at Tinicum, the beginning of the Delaware Estuary.
We collected two types of sediment samples and asked three questions.
-
Does land use, whether urban, agricultural, or forest, predict microplastic concentrations?
-
Will plastic be captured in reservoirs and estuaries before it reaches the ocean?
-
Which types of plastic are the most common and most toxic?
Sediment cores – long cylinders of material excavated from river or lake beds – have given us a chronological record of what has been deposited over decades. They also collected surface sediment samples at regular intervals along each waterway, from densely populated areas near Philadelphia to less densely populated areas such as Raystown Lake and Conemaugh River Lake in central Pennsylvania.

Water samples taken from rural Pennsylvania contained microplastic levels similar to those taken from the John Heinz National Wildlife Refuge in Philadelphia.
Matthew James
Remarkably, samples collected from the rural Raystown watershed, a largely forested area in central Pennsylvania, showed similar levels of microplastics as samples taken from the John Heinz National Wildlife Refuge, a watershed near Philadelphia International Airport.
On average, approximately 1,125 microplastic particles were found per pound (2,500/kilogram) of sediment. However, land use alone cannot reliably predict how much plastic will be found in a given waterway, as concentrations vary widely.
Estuaries are partially enclosed coastal areas where freshwater from rivers and streams mixes with seawater from the ocean, trapping microplastics but not enough to account for plastic lost to the ocean.
The most abundant types of plastics we found were polypropylene and polyurethane (both single-use plastics), along with tire rubber. Single-use plastics, or single-use plastics, are plastic items that are used once and then thrown in the trash, such as bread bags, plastic bottles, and straws.
Finally, we found that microplastic accumulation in Pennsylvania sediments has doubled approximately every 20 years since 1950, reflecting increased global production. This was determined by drilling deep into the sediments of reservoirs and estuaries. There, layers of sediment accumulate over time, like the rings of a tree. There is old material at the bottom and new material at the top. By analyzing the chemistry of each layer, they were able to estimate when it was deposited and how much plastic it contained.
We dated the sediment layers using radioactive decay, the same basic principle behind carbon dating. One method tracks lead-210 as it decays at a known rate, allowing researchers to determine the age of each sediment layer. The other uses the artificial isotope cesium-137, which peaked in 1964, associated with nuclear weapons testing, and serves as a fixed timestamp in the sediment record. Combining these methods helps build a timeline of when each layer of sediment and the plastic trapped within it was deposited.
a little hope
Here’s some encouragement. We found a small but measurable decrease in microplastic concentrations in the most recent sediment layer, which can be dated to approximately the 2000s based on depth and deposition rate. This may reflect improved recycling rates and wider awareness of plastic waste. Although it is modest, it suggests that the problem is at least partially responsive to human behavior.
Besides recycling your plastic, what can you do to reduce your exposure to microplastics and reduce their prevalence? You can stay informed about which plastics pose the greatest health risks and check the recycling number on the bottom of your container before you buy. You can also replace single-use plastic cups, straws, and food containers with alternatives like glass, stainless steel, and unbleached paper.